Showing posts with label Stats. Show all posts

Thursday, April 18, 2013

2012-2013 Single Game Stats


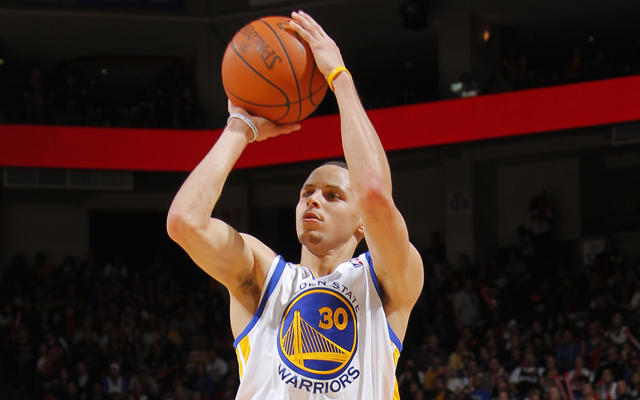
  1. Steph Curry - 54
  2. Kevin Durant - 52
  3. Carmelo Anthony - 50
  4. Kobe Bryant - 47
  5. Steph Curry - 47
  6. John Wall - 47
  7. James Harden - 46
  8. Carmelo Anthony - 45
  9. Carmelo Anthony 45
  10. James Harden - 43
Honorable Mentions:
Jeff Green - 43
O.J. Mayo - 40
Al Jefferson - 40

Notes: Steph Curry's 54 points are the 10th highest since 2000-2001 (Kobe Bryant - 81 pts - 2006).

Kobe Bryant (8), Carmelo Anthony (8), Kevin Durant (6), Steph Curry (2), James Harden (2), and Kyrie Irving (2) were the only players to record multiple 40+ point games.

Kobe/Carmelo's (8) 40 point games are the 10th most since 2000-2001 (Kobe Bryant - 27 - 2005/2006)

14 players recorded a 40+ point game (the lowest amount of players since 2000-2001)

  • Paul Pierce (40 points) had the best FG% (81.3) and Kevin Durant (52 points) had the worst FG% (41.9).
  • John Wall (47 points) attempted the most free throws (24) and Deron Williams (42 points) attempted the least free throws (1).
  • Kevin Durant (52 points) played the most minutes (50) and Paul Pierce (40 points) played the least minutes (34).
  • Deron Williams (42 points) had the most 3PA (16) and Al Jefferson had the least 3PA (0)
  • LeBron James (40 points) had the most assists (16) and Kobe Bryant (40 points)/Carmelo Anthony (41/42/42 points)/Kevin Durant (52 points) had the least assists (1).
  • Carmelo Anthony (41 points) had the most rebounds (14) and also the least rebounds (2)
  • Steph Curry scored the most points in a loss (54)

Sunday, February 3, 2013

The Most Ineffecient Scorers of 2012-2013 (So Far)

League Averages to date:

  • 44.9 Field Goal %
  • 49.2 eFG% (Effective Field Goal Percentage, this statistic adjusts for the fact that a 3-point field goal is worth one more point than a 2-point field goal.)
  • 1 Free Throw per 4.90 Field Goals Attempted
  • .204 Free Throws/Field Goal Attempts
  • 15 Player Efficiency Rating


This is a list of everyone attempting 10 or more shots a game while only averaging only 1 more point per game than shots attempted per game.
  • >= 10 FGA/G
  • PPG - FGA/G = <=1

I added Monta Ellis to the list because he was really close to the target numbers and the sheer volume of shots he puts up at an average effeciency deserves mention.  He's 4th in the league in shots attempted per game.

All stats taken from the amazing BasketballReference.


Monta Ellis 


  • 18.6 Points Per Game on 17.4 Field Goal Attempts
  • 1 Free Throw Made per 4.70 Field Goal Attempts
    • .213 FT/FGA
  • 40 FG%
  • 42.6 eFG%
  • 36.4 Minutes Per Game
  • 15.4 PER

Rudy Gay


  • 17.3 points on 16.4 Field Goal Attempts
  • 1 Free Throw Made per 5.86 Field Goal Attempts
    • .171 FT/FGA
  • 41.1 FG%
  • 44.1 eFG%
  • 36.6 MPG
  • 14.4 PER

Raymond Felton


  • 15.1 Points on 15.3 Field Goal Attempts
  • 1 Free Throw Made per 11.7 Field Goal Attempts
    • .085 FT/FTA
  • 40.1 FG%
  • 45.1 eFG%
  • 33.5 MPG
  • 15.4 PER

Thursday, April 26, 2012

Fun with Basketball Reference: 2012 Single Game Stats

Most Shot Attempts


No surprises here. How about that monstrous 40/19/4 game from Kevin Love? That was a bit better than Melo's 25 points on 30 shots. Yikes.


Most Points


Wow, I definitely forgot about Deron going off for 57. Look at that shit. 57 points on 29 shots. That is what would commonly be referred to as "effeciency" or "woah dude that's really good". 21 free throw attempts!

Also shout out to my dawg Ben Gordon for randomly going off for 45 in a game this year. Kind of miss you, BG.

He's probably grabbing his nuts with his other hand

The NBA's Best Lineups and How Chicago Compares

With the Bulls' last game of the regular season tonight against the Cavs, I thought I'd take a look at how Chicago's 5 man units performed. This will mostly be per 100 possessions statistics because that shit is so good.


Best NBA Point Differential Lineups


The Bulls' most used lineup this year was Rose, Brewer, Deng, Boozer, and Noah. That lineup also turned out to be the best overall lineup of the 2012 season with a point differential of +17.0 in 290 minutes. This lineup ranked 2nd in the league in DRtg (96.0) and was 5th in ORtg (113.0). That's pretty fucking impressive.

It's scary to think about how good this team would have been if they would have stayed 100% healthy this year. The Heat's best lineup (+10.3) of Chalmers, Wade, James, Bosh, and Anthony played 533 minutes in 39 games and locked up the 2nd seed in the East. The Pacers' best lineup (+9.0) of Collison, George, Granger, West, and Hibbert played 1000 minutes in 55 games and locked up the 3rd seed in the east. Basically what I'm trying to say is, the best possible team they could assemble played about 2x the amount of minutes (Heat) and 3.5x the amount of minutes (Pacers) more than the Bulls this year.

Thursday, March 8, 2012

What's the Difference Between C.J. Watson and John Lucas III?


The Bulls just lost to the Magic, it's after 11pm, and I'm drunk. Let's look up some fucking stats.

John Lucas III hasn't been awful this season. I've always just assumed he was just a shitty, undersized chucker, but this season he has filled his position relatively well in a time of need with Rose and C.J. missing sizable chunks of the season. In the random arbitrary number of 20 minutes played (6 games), JLIII has averaged 13.2 PPG on 48% eFG%. Pretty okay, right? The Bulls are 4-2 in those games, which is also pretty okay. But how much better is C.J.?

The easiest way to compare the two is just a straight head to head comparison of the two. Lucas has actually played in two more games than Watson this year (29-27, Lucas starting 2 games and Watson starting 8), but Watson has played 237 more minutes.

The per game comparison looks like this:


Player G GS MP FG FGA FG% 3P 3PA 3P% FT FTA FT% ORB DRB TRB AST STL BLK TOV PF PTS
John Lucas 29 2 11.9 2.1 5.6 .383 0.8 1.8 .431 0.5 0.6 .824 0.4 0.9 1.3 1.7 0.3 0.0 0.8 0.8 5.5
C.J. Watson 27 8 21.5 3.4 8.5 .400 1.4 3.3 .432 1.6 2.0 .796 0.4 1.5 2.0 3.9 1.0 0.1 1.7 1.9 9.8
Provided by Basketball-Reference.com: View Original Table


C.J. looks like the obvious favorite here. This doesn't exactly tell the whole picture though. C.J.'s higher minutes per game yield higher per game numbers (obviously). Yes I think C.J. is the better player thus justifying him getting more minutes, but let's take a look at each player's per-36 numbers.


Wednesday, March 7, 2012

A Statistical Look at the Bulls with Rip Hamilton in the Lineup


Rip Hamilton is injured again.

I'll pause for a few seconds to let everyone finish gasping and questioning their god.

Okay, good. Shocking right? Not really. I WAS BEING SARCASTIC. Anyways, I thought I would take a look at the statistical impact Rip has had on the Bulls when he's played with the full starting lineup. Join me on this magical journey.

For this, I will be using the awesome Play Index+ and, more specifically, the Lineup Finder.

Now before I look up these numbers let me just say that with the "eye test", Rip seems to provide a whole different dimension to the offense. He draws attention from multiple defenders coming off screens and takes much needed pressure to score off of Rose. If Rip was healthy, I think the Bulls would have a decent shot to take down the Heat. On to the numb3rz!

The two lineups the Bulls have used the most this season and the lineups that I will be comparing:
  • Rose, Brewer, Deng, Boozer, Noah
    • 235 minutes played in 18 games
      • 13.05 minutes per game
  • Rose, Hamilton, Deng, Boozer, Noah
    • 164.9 minutes played in 9 games
      • 18.32 minutes per game

Monday, March 5, 2012

Fun with Basketball-Reference: Chicago Bulls Part 1

I like to poke around Basketball Reference to pass the time when I'm bored, so I might as well post about it every now and then. Here are some interesting things I've found this season.


  • Ronnie Brewer
    • eFG% is 5% better on the road
    • Assisted on 5% more of his shots on the road
    • Shooting 1/9 3PT in losses this year
    • .384 eFG% on jump shots
    • eFG% breakdown of each quarter
      • 1st - 39/75 - 56.7%
      • 2nd - 27/63 - 42.9%
        • No 3PM in 2nd Quarter this year
      • 3rd - 27/79 - 35.4%
      • 4th - 15/36 - 47.2%
    • Career worst .460 eFG%
      • His eFG% has been on a steady decline since 2008
        • 08-09 .522
        • 09-10 .497
        • 10-11 .487
        • 11-12 .460
    • Career worst TOV% of 10.4% (career avg 9.7)